Falling Wedge Pattern: How to Spot and Trade the Breakout (With Chart Examples)

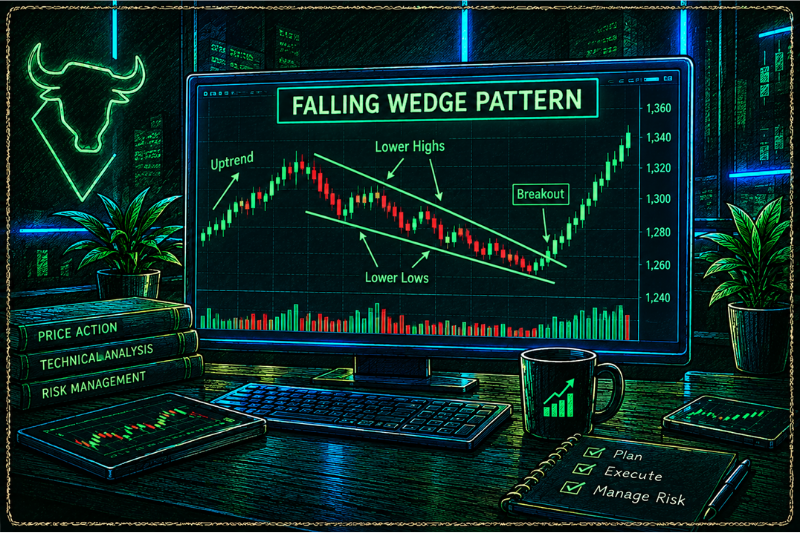
In Thomas Bulkowski's study of 800+ falling wedges, 68% broke out to the upside, and the pattern shows up across financial markets, from stocks and gold to forex pairs like EUR/USD.
That is the definition. Trading it well is a different job. Emotions are often a trader's worst enemy, and pattern-based trading strategies like this one give you something better than a gut feeling: a clear setup with defined entry and exit points.
Key Takeaways
- A falling wedge pattern is a bullish chart pattern formed by two converging downward trendlines, and it breaks upward about 68 percent of the time in Thomas Bulkowski's research
- The pattern is confirmed only when a candle closes above the upper trendline, ideally on rising volume
- The standard price target is the height of the wedge at its widest point, added to the breakout price
How Do You Identify a Falling Wedge Pattern?
You identify a falling wedge pattern by checking five things on the chart. All five should be true before you call it a wedge.
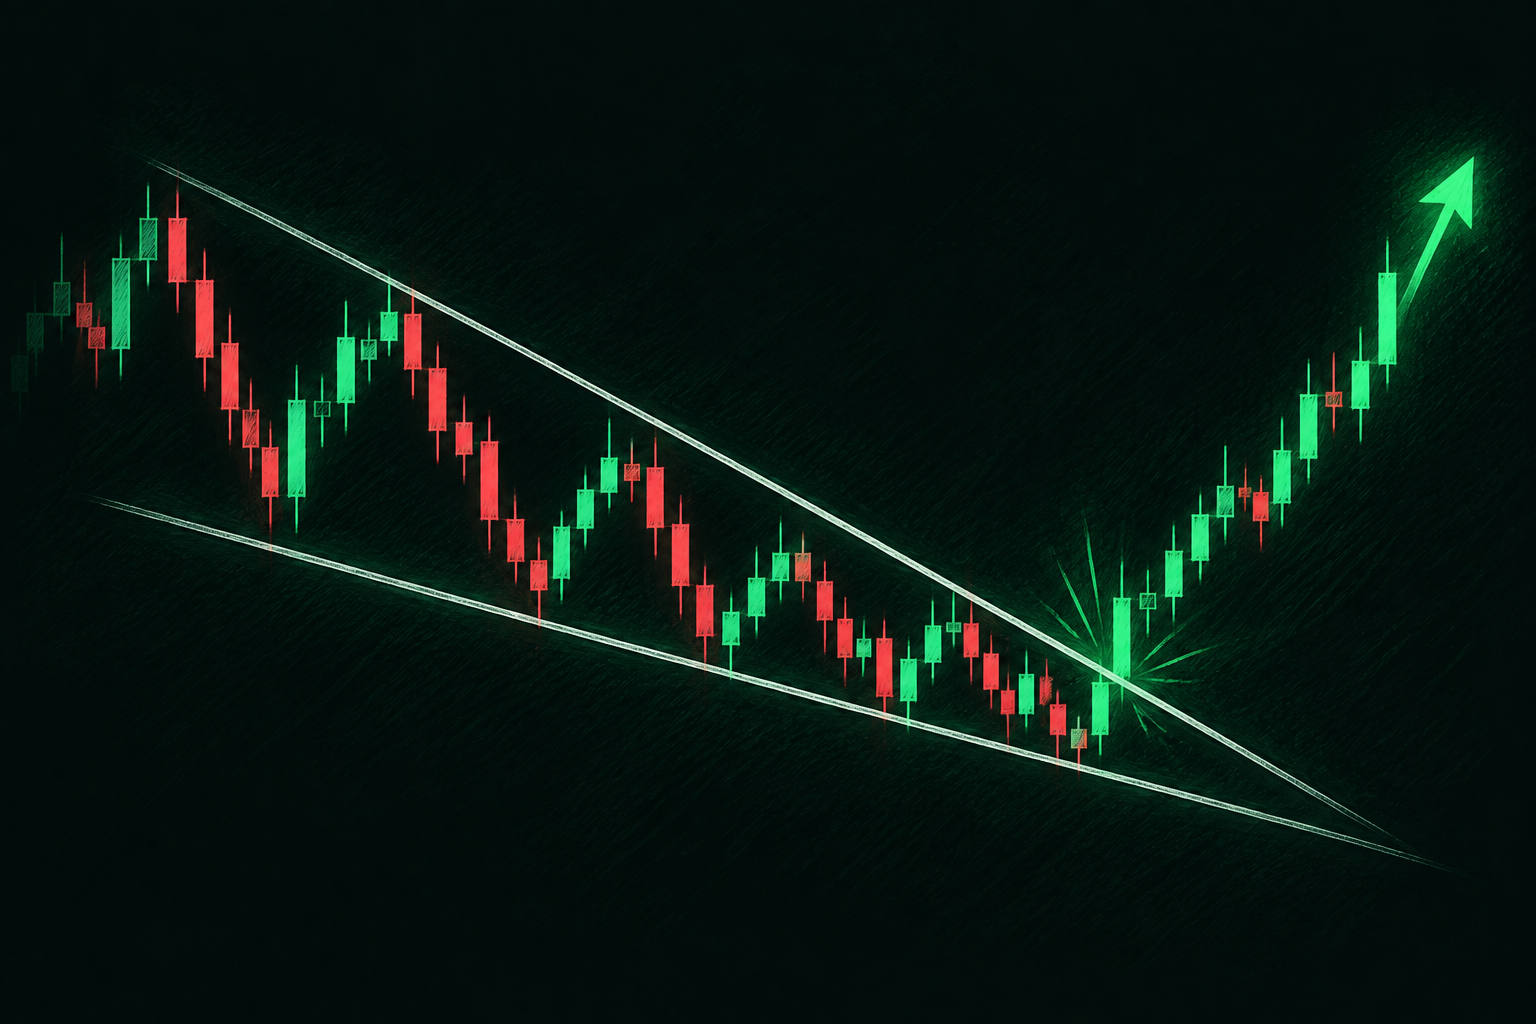
- Two falling trendlines: The upper trend line connects the lower highs. The lower support line connects the lower lows.
- The lines converge: The upper line falls faster than the lower trend line, so the range gets narrower over time.
- At least five touches: Look for three touches on one line and two on the other. Fewer touches usually means you are forcing the pattern.
- Enough time: On a daily chart, a falling wedge needs at least three weeks to form. Anything shorter is usually a pennant.
- Shrinking volume: Trading volume usually falls as the wedge tightens. Bulkowski found volume trends down in 72 to 75 percent of falling wedges before the breakout.
A falling wedge is easy to confuse with two other consolidation patterns. In a descending channel, the two lines run parallel. In a descending triangle, the bottom line is flat. Only the falling wedge has two falling lines that squeeze together.
Is a Falling Wedge Bullish or Bearish?
A falling wedge is bullish. The price direction inside the wedge is down, but each new low comes with less force. That loss of downside momentum is what makes the falling wedge pattern bullish, and it is why most breakouts go up.
It is not a guarantee. Around one in three falling wedges breaks down instead of up. That is why you wait for confirmation before you enter, which we cover below.
Is a Falling Wedge a Reversal or Continuation Pattern?
A falling wedge can be either one, and the trend direction before it tells you which. Both versions are bullish.
The Continuation Pattern
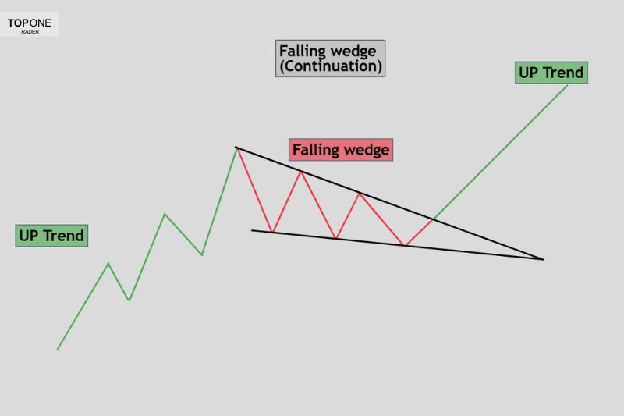
A continuation of falling wedge forms during an established upward trend. Price pulls back and consolidates inside the wedge before the move higher resumes. Think of it as a breather for the market.
During the pullback, volume usually drops. Sellers push the price lower, but each push is weaker than the last. The lows fall more slowly than the highs, which creates the narrowing wedge shape.
The pattern completes when the price breaks above the upper trendline. A volume increase on that breakout shows buyers are back in control, and the uptrend continues.
The Reversal Pattern
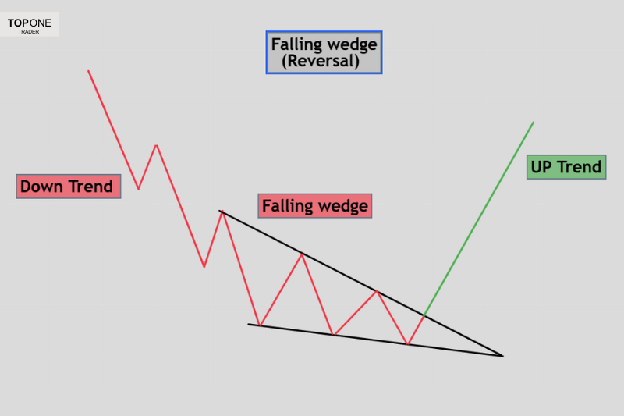
As a trend reversal pattern, the falling wedge forms at the end of a downtrend. Price is still trending lower with lower highs, but the lows drop more gradually. Selling pressure is fading, and buyers are starting to step in.
Volume usually falls while the wedge forms, which shows indecision. Once the price breaks above the upper trendline with rising volume, the reversal is confirmed. StockCharts notes that a reversal wedge should follow a downtrend of at least three months on a daily chart, so a short dip does not count.
How Do You Trade the Falling Wedge Pattern?
You trade a falling wedge by buying the breakout above the upper trendline, placing a stop below the last swing low, and targeting the height of the wedge. Here is each step.
Entry: Breakout Close or Retest
Wait for a candle to close above the upper trendline. A wick that pokes above the line and falls back is not a bullish breakout. Many false breakouts look exactly like that.
You have two ways in:
- Breakout entry: Buy at or just above the broken trendline once the candle closes. You get in early, but you take more false signals.
- Retest entry: Wait for price to come back and test the broken trendline as support, then buy. Bulkowski found price throws back to the breakout area in 62 percent of upward breakouts, so this entry is often available. It gives a tighter stop and a better risk-to-reward ratio.
Stop Loss
Place your stop below the most recent swing low inside the wedge. Conservative traders put it below the whole wedge formation instead. The wider stop is safer, but it lowers your risk-to-reward ratio.
Price Target: The Measured Move
Measure the height of the wedge at its widest point, at the start of the pattern. Add that distance to the breakout point. That is your target.
Here is a worked example on EUR/USD. The wedge starts with a high of 1.1100 and a low of 1.1000, so it is 100 pips tall. Price breaks out at 1.1050. Your target is 1.1050 plus 100 pips, which is 1.1150. If the last swing low is 1.1010, your stop is 40 pips away. That is a risk of 40 pips for a reward of 100 pips, or 1:2.5.
Treat the target as an estimate. Bulkowski found falling wedges hit the measured target 62 percent of the time. Also check for recent swing highs between your entry and the target, because price often stalls there.
Trading Continuation Setups
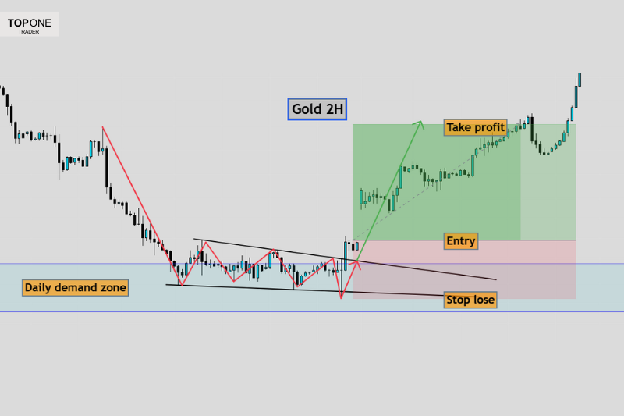
Patience matters most here. Wait for the close above the upper trendline, and look for a clear jump in volume when the breakout occurs. Enter at or just above the broken trendline, with your stop below the most recent swing low.
Examples
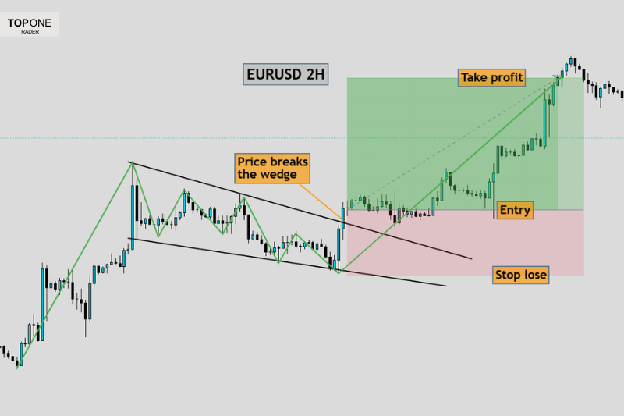
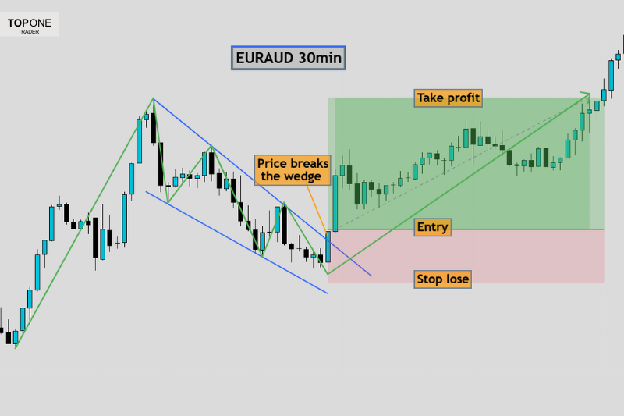
Having a clear strategy is essential, but you need capital to turn that strategy into profits. Top One Trader provides you with the capital and equips you with the essential tools to trade successfully. Sign up today to get your funded account.
Trading Reversal Setups
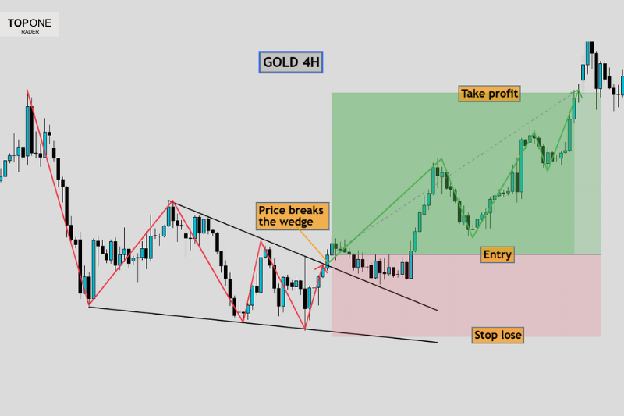
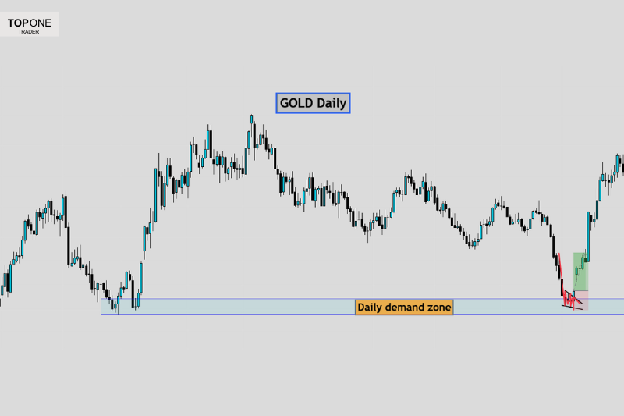
The rules are the same, but reversals need extra caution. You are trying to catch a major trend change, so confirm the setup on higher time frames. Key levels on the 4-hour or daily chart carry more weight than levels on a 15-minute chart.
The strongest reversal wedges form right on one of those key levels, such as a daily demand zone. The breakout above the upper trendline, with a sharp rise in volume, is your confirmation that buyers have taken control.
Examples
How Reliable Is the Falling Wedge Pattern?
The falling wedge is a solid pattern, but not an elite one. Thomas Bulkowski tested more than 800 falling wedges for his Encyclopedia of Chart Patterns research, and here is what he found in bull markets:
Bulkowski ranks the falling wedge 31 out of 39 bullish patterns. In plain terms, roughly one in four upward breakouts fails. The pattern alone is not enough, which is why the filters in the next section matter.
How Do You Confirm a Falling Wedge Breakout?
You confirm a falling wedge breakout with volume, a strong breakout candle, the right trend context, key levels, and momentum signals. Each filter removes some of the weak setups.
Volume and Candlestick
Look at the breakout candle itself. A large bullish candle that closes near its high is a strong bullish signal. A bullish engulfing candle with clear volume expansion is even better, because it shows buyers have fully taken over from sellers.
Trend Context
For trend continuation setups, the uptrend before the wedge should be clear, with higher highs and higher lows. If the prevailing trend is weak or choppy, the wedge is less reliable. Without strong buyers behind it, the breakout often fades.
A strong bullish trend before the wedge makes it more likely the wedge is a simple pullback, not the start of a deeper drop.
Key Levels
For continuation setups, check what sits above the wedge. If it forms just under a supply zone or major resistance, sellers often defend that level as the price approaches it, and the breakout stalls. Skip those trades and look for setups with clear space above.
For reversal setups, the opposite helps you. A wedge that forms on a strong support level, one that has held several times, has a better chance of working. Mark your key support and resistance levels before you trade any wedge.
RSI Divergence
Divergence on the relative strength index (RSI) is one of the best confirmations for a falling wedge. Price makes lower lows inside the wedge, but the RSI makes higher lows. That gap shows sellers are losing momentum even though price is still falling.
In a continuation setup, divergence suggests the pullback is ending. In a reversal setup, it suggests the downtrend is running out of sellers. Divergence on the 4-hour or daily chart carries more weight than on short time frames.
Fibonacci Levels
Fibonacci levels help you fine-tune entries and targets. After the breakout, a pullback into the 0.618 to 0.786 retracement of the breakout move is a common low-risk entry zone, often called the Optimal Trade Entry (OTE). For reversal trades, the 0.618 retracement of the prior downtrend is a sensible first target, and the 1.00 level is a bigger second target.
How Should You Manage Risk on a Falling Wedge Trade?
Manage risk by keeping a reward of at least twice your risk and risking only a small, fixed share of your account on each trade. No pattern works every time, so your risk rules decide whether you last.
A 1:2 risk-reward ratio means you aim to make $2 for every $1 you risk. At that ratio, you only need to win about 33 percent of your trades to break even. At 1:3, the break-even win rate drops to 25 percent. That cushion is what keeps you profitable through losing streaks.
Size each position from your stop distance, not from a hunch. Risk 0.25 to 0.5 percent of your account per trade, especially on prop firm accounts with strict drawdown limits. For example, 0.5 percent of a $100,000 account is $500. With a 40-pip stop on EUR/USD, where one standard lot is worth about $10 per pip, that works out to 1.25 lots.
If you are working through an evaluation, our guide to Forex trading patterns for prop firm challenges shows how the falling wedge fits alongside other setups that suit strict drawdown rules.
What Is the Difference Between Rising and Falling Wedge Patterns?
Rising and falling wedge patterns are mirror images that point in the opposite direction. A rising wedge slopes up and usually breaks down. A falling wedge slopes down and usually breaks up. You will also see the falling wedge called a descending wedge and the rising wedge called an ascending wedge.
The table below shows the key differences between the two patterns.
The trading rules for falling and rising wedge patterns in trading are the same in reverse. With a rising wedge, you wait for a close below the lower trendline, place the stop above the last swing high, and project the wedge height downward.
When Does a Falling Wedge Pattern Fail?
A falling wedge fails when the price closes below the lower trendline instead of above the upper one. That breakdown cancels the bullish setup and often means the downward trend will continue.
Bulkowski found a downward breakout happens in about 32 percent of falling wedges, with an average decline of 14 percent after the breakdown. Upside breakouts can fail too, when price closes back inside the wedge soon after breaking out. Your stop loss is what keeps either failure small.
Conclusion
A falling wedge pattern gives you a clear, repeatable setup: two converging downward trendlines, a close above resistance, a stop below the last swing low, and a measured target. It works as a bullish reversal pattern after a downtrend and as a continuation pattern inside an uptrend.
It is also not a sure thing. About one in four upward breakouts fail, so the edge comes from the filters you add: volume, trend context, key levels, RSI divergence, and Fibonacci. Pair it with another day pattern you trust, and you will skip more of the weak setups.
No strategy wins every time. Size every position from your stop, keep your risk per trade small, and let the pattern prove itself before you commit capital. That is how you turn the falling wedge into a valuable tool that captures opportunities and protects your account. This article is for education only and is not investment advice.
Take your forex trading to the next level with Top One Trader. The platform supports various strategies and provides educational resources to help you build and refine your own strategy. Start trading today and gain access to the tools and support needed for success!
Frequently Asked Questions
What does a falling wedge pattern chart look like?
A falling wedge pattern chart shows price bouncing between two converging trendlines that both slope down, like a funnel pointing down and to the right. The upper line falls faster than the lower line. The pattern ends when the price breaks out of the narrow tip, usually upward.
What is a wedge pattern in trading?
A wedge pattern is a chart pattern in technical analysis where price moves between two trend lines that slope in the same direction and converge. A falling wedge slopes down and is usually bullish. A rising wedge slopes up and is usually bearish.
What is the best time frame for trading a falling wedge?
The 4-hour and daily charts give the most reliable falling wedges, because they filter out the noise of short-term price movements. You can trade wedges on 15-minute or 30-minute charts, but expect more false breakouts. Many traders spot the wedge on a higher time frame and time the entry on a lower one.
How long does a falling wedge take to form?
On a daily chart, a falling wedge takes at least three weeks, and reversal wedges often take three to six months. Shorter versions are usually classed as pennants. On intraday charts, the same shape can form within a few hours or days.