Head and Shoulders Pattern: Trading Guide for Beginners

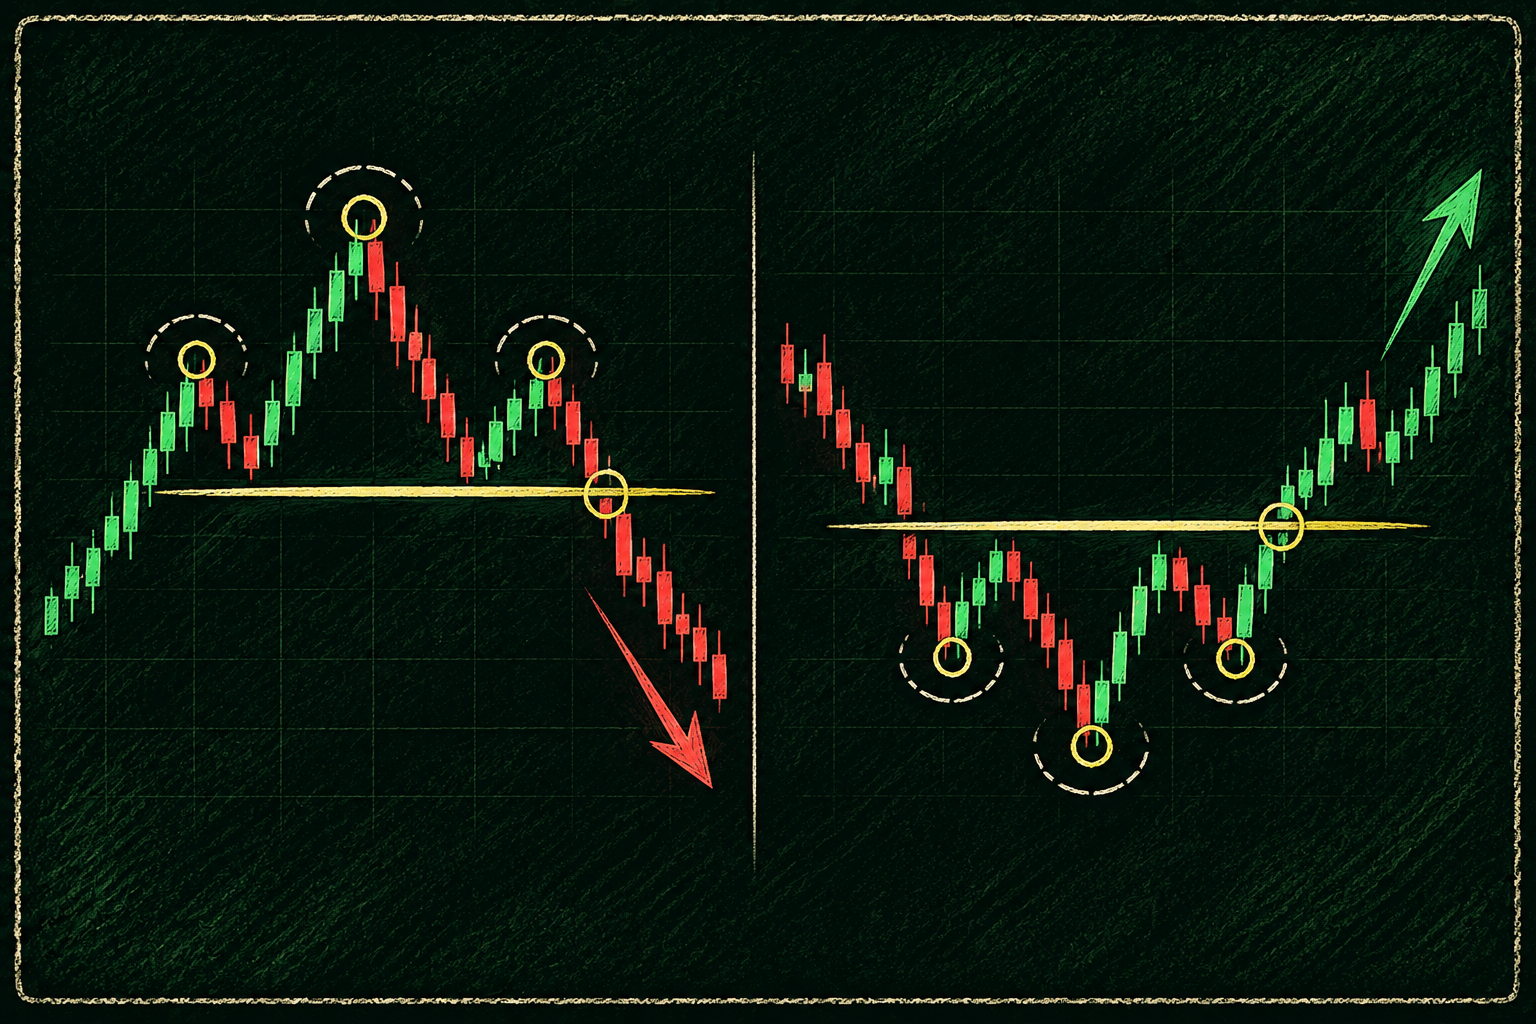
In this guide, we’ll break down how the pattern and its inverse form, how traders use them, and what to watch before entering a trade.
Key Takeaways
- A standard head and shoulders pattern is a bearish reversal signal confirmed by a close below the neckline, while the inverse version is bullish and confirmed above the neckline.
- Traders measure the distance from the head to the neckline to set a price target, then use confirmation and a stop loss because both versions can fail.
What Is the Head and Shoulders Pattern?
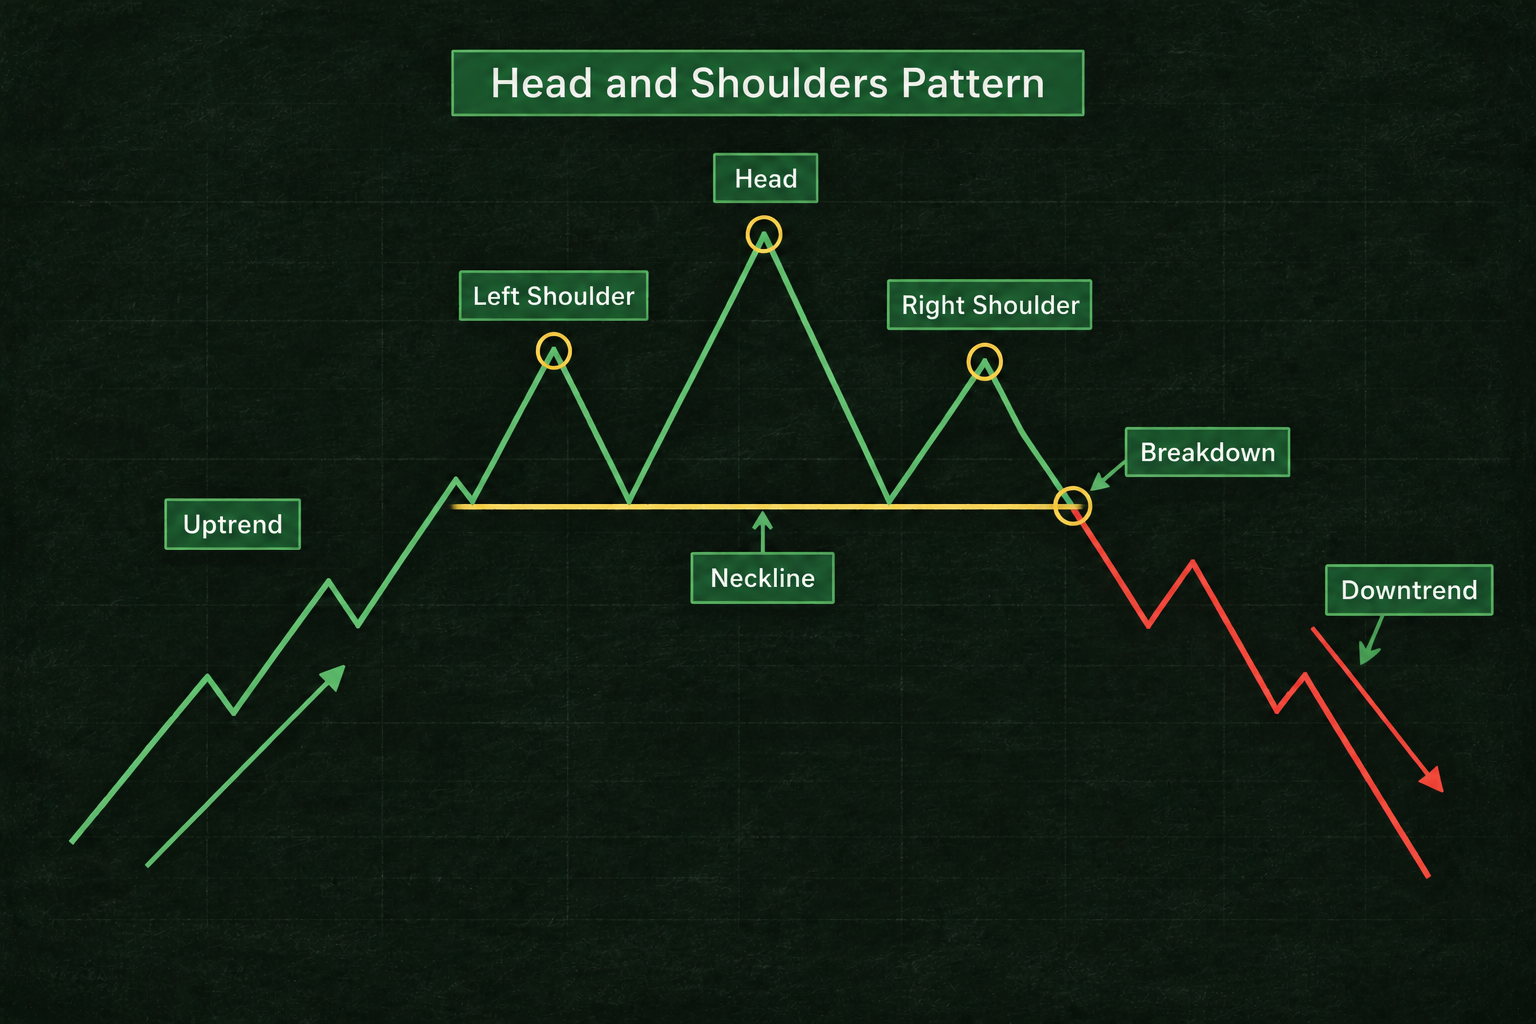
A head and shoulders pattern is a chart formation in technical analysis that signals a likely reversal from an uptrend to a downtrend. It is one of the best-known chart patterns among technical analysts because its shape tells a clear story about buyers losing control.
Here is that story in three moves. Buyers push prices to a high (the left shoulder). They push to an even higher high, the central peak (the head). Then they try a third time and fail to beat the head (the right shoulder). That failed rally shows demand is fading. When price then breaks the support line under the pattern, sellers have taken over.
What Is the Difference Between Head and Shoulders and Inverse Head and Shoulders?
The head and shoulders pattern is bearish and forms at the top of an uptrend, whereas the inverse head and shoulders pattern is bullish and forms at the bottom of a downtrend. The inverse is simply the upside-down version, so everything else is flipped.
Before you label either one, check whether the market is in a bullish or bearish trend.That prior trend tells you which version you are looking at.
The inverse version also goes by “head and shoulders bottom” or “reverse head and shoulders.” All three names mean the same pattern.
What Are the Parts of a Head and Shoulders Pattern?
A head and shoulders pattern has four parts: the left shoulder, the head, the right shoulder, and the neckline. Volume is the fifth piece many traders watch.
Left shoulder
The left shoulder formation begins when price rises to an initial peak during an upward trend, then pulls back. Nothing looks wrong yet. It still reads like a normal pullback.
Head
The head formation appears when price rallies to a higher peak than the left shoulder. Price then drops back to about the same level as the first pullback. This is usually the last strong push from buyers.
Right shoulder
The right shoulder formation starts when price rallies again but stalls below the head. This lower high is the warning sign. Buyers no longer have the strength to make a new high.
Neckline
The neckline is a horizontal line, or a slightly tilted trend line, drawn through the two lows on either side of the head. It acts as support. A confirmed break, meaning a full candle close below it, completes the pattern.
Not every pattern has a flat neckline. Necklines can slope upward or downward, and the neckline slope tells you something. In a top, a downward sloping neckline is more bearish, since the low after the head is already lower than the low before it. In the inverse version, StockCharts notes that a neckline with an upward slope is more bullish than a downward one.
Volume
Trading volume often runs highest on the left shoulder and fades into the right shoulder. In Bulkowski’s study of more than 2,800 head and shoulders tops, volume trended downward across the pattern 61% of the time. A volume spike on the neckline break shows sellers are finally committing.
Inverse version: flip every part of the standard head and shoulders. The shoulders and head are troughs, the head is the lowest point, and the neckline connects the highs between them. Volume matters even more on the breakout of an inverse pattern, because a rally needs buyers to step in.
How Do You Trade a Head and Shoulders Pattern?
You trade a head and shoulders pattern by entering short after a candle closes below the neckline. Your stop goes above the right shoulder, and your target equals the pattern’s height. Here is the full process for finding your entry and exit points.
Step 1: Confirm the uptrend. The pattern signals a potential trend reversal. When a head and shoulders pattern appears without a clear uptrend before it, there is nothing to reverse.
Step 2: Spot three distinct peaks. The head must be the highest. The two shoulders should peak at roughly similar levels.
Step 3: Draw the neckline. Connect the two lows on either side of the head.
Step 4: Wait for a close below the neckline. If price breaks the line but only leaves a wick, that is not enough. A full candle close is the confirmation. This is the best defense against a false breakout.
Step 5: Choose your entry. You have two options:
- Breakout entry: Enter short on the close below the neckline. You get in early, but you take more fakeout risk.
- Retest entry: Wait for price to rally back to the broken neckline and fail there. Bulkowski found price pulled back to the neckline in 68% of tops, so this entry shows up often and usually gives a tighter stop.
Step 6: Place your stop. Stop-Loss orders belong just above the right shoulder. If price climbs back above it, the pattern has failed.
Step 7: Set your target. Measure the vertical distance from the top of the head down to the neckline. Subtract that distance from the breakout point to get your target price.
Example of a bearish head and shoulders trade:
Here you risk $7 to make $9.50. That is roughly a 1:1.4 risk to reward. If your plan requires 1:2 or better, this trade does not qualify on the breakout. A retest entry closer to $100 with a stop just above the retest high can fix that.
What Is an Inverse Head and Shoulders Pattern?
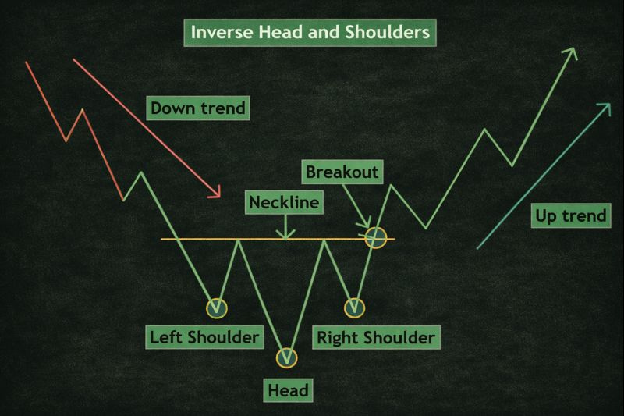
The inverse head and shoulders pattern is a bullish reversal chart pattern with three troughs, where the middle trough (the head) is the lowest. A close above the neckline signals that a downtrend is ending and a new bullish trend is likely starting.
The inverse head and shoulders is a bullish pattern that forms after a sustained downward trend. Each sell-off attracts less selling. The left shoulder forms at a fresh low, and the head marks the low point in market sentiment. When the right shoulder forms as a higher low, it shows sellers can no longer push price as far.
The neckline connects the two highs between the troughs and acts as resistance. Once price closes above it, that old resistance often turns into support, which is why many traders wait for a retest before buying.
How Do You Trade the Inverse Head and Shoulders Pattern?
You trade the inverse head and shoulders pattern by going long once price closes above the neckline. Your stop goes below the right shoulder, and your target is the pattern's depth projected upward. It is the same process, flipped.
Do not try to buy the exact bottom. Wait for a close above the neckline to show that buyers have taken control. The pattern is more reliable when it forms at a major support level or demand zone.
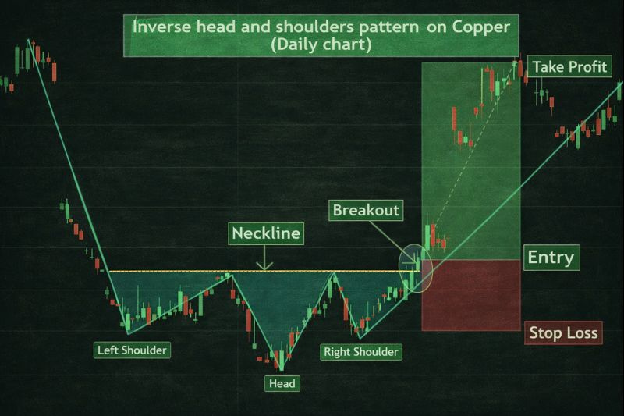
Entry: Buy once price closes above the neckline. For a more cautious entry, wait for a retest of the neckline as new support. Bulkowski recorded a throwback to the neckline in 65% of inverse patterns.
Stop loss: Place it just below the right shoulder. If the price falls back below that low, the setup is invalid.
Target: Measure from the bottom of the head up to the neckline. Add that distance to the breakout price.
Example of an inverse head and shoulders trade:
You risk $5 to make $9.50, about a 1:1.9 risk to reward. Some traders also set multiple profit targets at key resistance levels, taking partial profits on the way.
Ready to apply trading patterns in real market conditions?
Join Top One Trader and access flexible funded accounts, expert educational content, transparent rules, and a supportive trading community built to reward disciplined, serious traders.
How Reliable Is the Head and Shoulders Pattern?
The classic head and shoulders pattern is one of the more reliable reversal patterns, but it still fails often. Never trade it without a stop. The best public data comes from Thomas Bulkowski, author of the Encyclopedia of Chart Patterns, who tracked thousands of examples.
Source: Bulkowski’s head and shoulders top and head and shoulders bottom statistics on ThePatternSite.
Three takeaways stand out:
- The inverse version has performed better. It failed less often and hit its target 71% of the time, compared with 51% for tops.
- The measured target is a guide, not a promise. For tops, it was reached only about half the time. Consider taking partial profits before the full target.
- Retests are common. With pullbacks in roughly two out of three cases, waiting for the retest is a practical entry plan, not just a cautious one.
Keep in mind these figures are idealized “perfect trade” results that assume the best possible exit. Real trades with real entries, slippage, and costs will do worse. Past performance does not guarantee future results, so use them to set expectations, not to predict your next trade.
A Practical Framework for Trading Head and Shoulders Patterns

A structured checklist makes head and shoulders pattern trading more consistent than relying on how the pattern looks. Run every setup through these six filters.
Asset
Both patterns form in forex, stock indices, individual stocks, futures, crypto, and commodities like gold and oil. They work best in liquid markets, where swings form cleanly and breakouts are more trustworthy.
- Major forex pairs like EUR/USD and indices like the S&P 500 usually produce cleaner structures.
- Thinly traded assets create more noise and more false signals.
- Volatile markets like crypto need stricter confirmation and tighter risk control.
You have a better chance to pass prop firm challenges understanding patterns like this one in context, not just by their shape.
Timeframe
Head and shoulders patterns appear on every timeframe, but higher timeframes are more reliable. A pattern on a daily or 4-hour chart is more likely to mark a major trend reversal than one on a 5-minute chart.
- Higher timeframes give cleaner structure and stronger signals.
- Lower timeframes give more setups but need extra confirmation.
- Many traders spot the pattern on a higher timeframe and fine-tune the entry on a lower one.
If you trade intraday, our day trading patterns guide covers the setups that work best on short timeframes.
Structure
A valid pattern needs a clear structure. In a top, the head must be the highest point and the right shoulder must fail to make a new high. In an inverse pattern, the head must be the lowest point and the right shoulder must hold above it.
A high-quality structure has:
- A clearly defined head and two shoulders
- Shoulders at roughly similar levels and similar distances from the head
- A clean neckline connecting two obvious swing points
If you have to squint to see it, skip it. Forcing the pattern onto messy price action leads to bad trades.
Confirmation
Confirmation separates real reversals from random shapes on a chart. Look for clear evidence that the other side has taken control.
Common confirmation signals include:
- A strong neckline breakout candle that closes on higher volume
- A retest of the neckline that holds as new support (inverse) or resistance (top)
- Alignment with a higher-timeframe support or resistance zone
- Momentum confirmation, such as RSI crossing 50 or a MACD crossover in the direction of the break
The more of these line up, the stronger the setup.
Risk Management
Set your risk before you enter. Put your stop where the trade idea is proven wrong, not where a loss starts to feel uncomfortable.
- Place stops above the right shoulder (top) or below it (inverse).
- Size each position to fit your risk tolerance, so every trade risks the same amount.
- Check that the target gives you enough reward for the risk.
- Focus on risk to reward, not win rate.
This matters even more in a funded account, where daily loss limits leave little room for an oversized position.
Confluence
Confluence is when several technical factors point the same way. It makes a head and shoulders setup much stronger.
Useful confluence includes:
- Higher-timeframe support, resistance, or supply and demand zones
- Moving averages that line up with the breakout
- Trendline breaks near the neckline
- Fibonacci levels that support your target or retest area
Backtest the pattern on the assets and timeframes that fit your trading style. Your own data will tell you more than any general statistic.
What Mistakes Do Traders Make With Head and Shoulders Patterns?
The most common head and shoulders mistakes are entering before the neckline breaks, ignoring volume, and seeing the pattern where it does not exist. Most failed trades come from execution errors, not from the pattern itself.
- Entering before confirmation: Guessing the neckline break gets you in early, and many of those trades get caught in false moves. Wait for a full candle close through the neckline before you act.
- Ignoring volume: A break on weak volume often has no big players behind it, so price can snap back through the neckline. Simple volume analysis fixes this: look for a clear rise in volume on the breakout candle.
- Misreading the structure: Not every set of three peaks or troughs is a head and shoulders. An uneven shoulder formation and unclear swings usually mean random noise. If you have to squint to see the pattern, skip the trade.
- Placing stops in the wrong spot: Stops set too tight, or not tied to the pattern, get hit by normal price swings while the setup is still valid. Put your stop beyond the right shoulder, then size the position to fit that distance.
- Trusting the pattern alone: No pattern is a sure thing, and ignoring bigger market trends leads to avoidable losses. Back the setup with higher-timeframe support or resistance and other technical indicators, like RSI or moving averages.
Final Thoughts
The head and shoulders pattern can be a useful reversal signal, but the shape alone is not enough. The strongest setups come from waiting for a confirmed neckline break, checking the wider market context, and planning the stop and target before entering.
The inverse version works on the same principle in the opposite direction, helping traders identify when selling pressure may be fading and buyers are starting to take control.
Used with volume, support and resistance, and disciplined risk management, both patterns can become reliable tools in a broader trading strategy. The key is not predicting the reversal early, but waiting for the market to confirm it.
Ready to put these patterns into practice? Explore Top One Trader’s funded trading programs and trade with clear rules, flexible account options, fast payouts, and support designed for disciplined traders.
Frequently Asked Questions
Is the head and shoulders pattern bullish or bearish?
The head and shoulders pattern is a bearish pattern. It forms after an uptrend and signals a likely move lower once price closes below the neckline. The inverse head and shoulders pattern is the bullish version.
How reliable is the head and shoulders pattern?
The head and shoulders pattern is fairly reliable but not guaranteed. Thomas Bulkowski’s research found tops failed about 19% of the time and reached their price target about 51% of the time. Inverse patterns did better, with an 11% failure rate and a 71% target hit rate.
What timeframe is best for the head and shoulders pattern?
Higher timeframes, like the 4-hour and daily charts, give the most reliable head and shoulders patterns. Lower timeframes produce more setups but more false breakouts.
Does the head and shoulders pattern work in forex and futures?
Yes. The head and shoulders pattern works in forex, futures, stocks, and crypto because it reflects crowd behavior, not a specific market. In forex trading, it is most reliable on major currency pairs. In futures, index contracts give the cleanest patterns.
How do you calculate the head and shoulders price target?
Measure the distance from the head to the neckline. For a top, subtract it from the breakout point. For an inverse pattern, add it. If the head is at $110 and the neckline is at $100, the target price is $90.