Megaphone Pattern Explained: How You Can Trade It

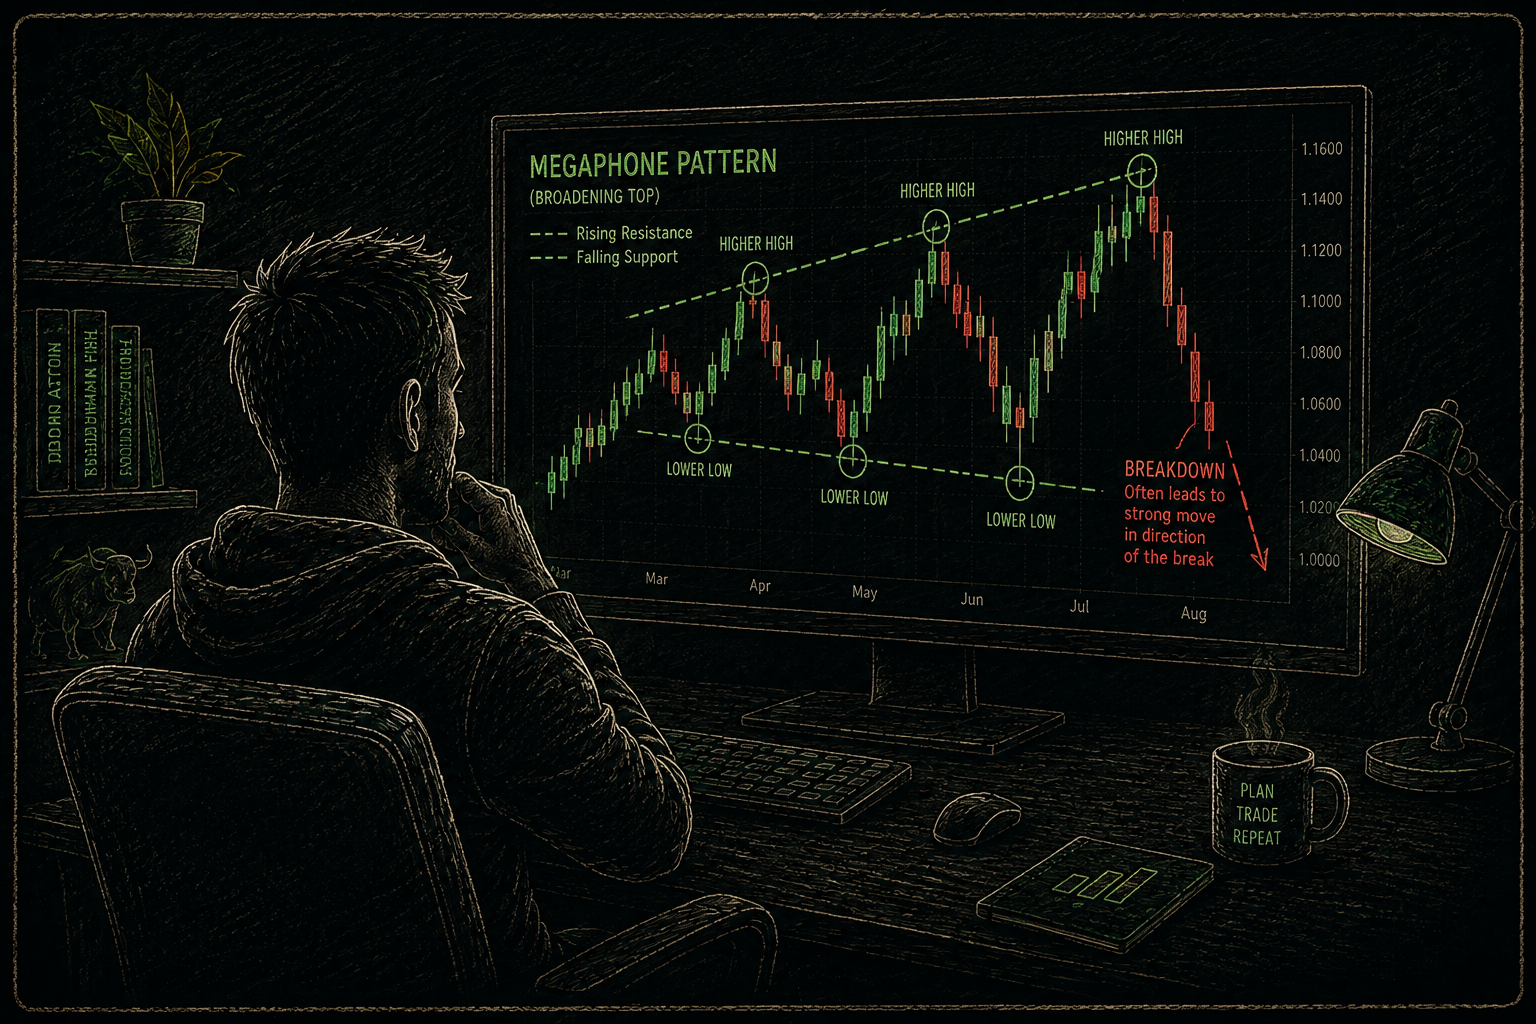
Traders use different strategies and patterns to find an edge and become profitable, as these patterns are often repeatable and can provide positive expectancy. The megaphone pattern is such a technical analysis chart formation that provides clear entry and exit points, giving traders an edge in the market.
Usually, the pattern looks like an expanding triangle, which signals rising volatility and growing indecision between buyers and sellers.
However, to trade it, you need to know how the pattern forms and how to spot, enter, and manage it reliably. You have come to the right place, as we are covering everything you need to know about the megaphone pattern.
Key Takeaways
- A megaphone pattern forms when price keeps making higher highs and lower lows, creating two trendlines that spread further apart as volatility picks up.
- The pattern itself does not signal a bullish or bearish move. Traders usually wait for a clear break above the upper trendline or below the lower trendline before deciding which way the price is likely to move.
What Is a Megaphone Pattern?
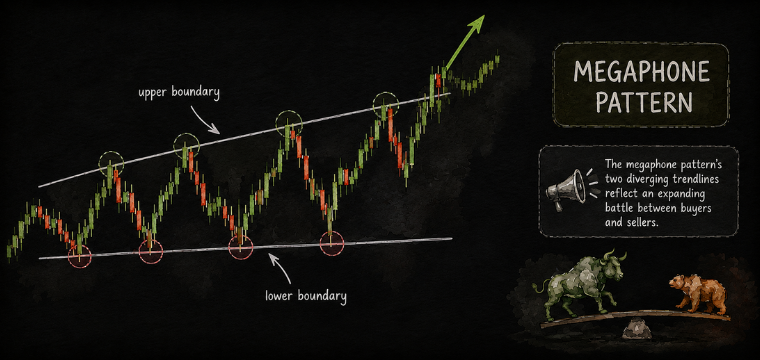
A megaphone pattern is a technical chart pattern defined by a minimum of two higher highs and two lower lows. Each move up pushes to a higher high, while the next selloff falls below the previous low. Draw a line across the highs and another across the lows; as the pattern develops, they spread further apart, giving the chart its familiar megaphone shape.
Traders use a few different names for the megaphone pattern depending on where it forms and what the trend looks like. It can be called a broadening formation, expanding triangle, broadening top, or broadening bottom. While the names differ, the setup stays the same: a widening triangle pattern.
This volatile price action could make the entry difficult as the pattern tightens before breaking out. Also, the move higher can quickly turn into a sharp drop, only for buyers to step back in again. But when interpreted correctly, this is also one of the most revealing patterns.
How does the megaphone pattern form?
The sequence typically unfolds like this:
- Price makes an initial high.
- A pullback forms the first swing low.
- Buyers push price above the previous high, creating a higher high.
- Sellers push price below the previous low, creating a lower low.
- Buyers stage another rally, printing a higher high.
There is no specific timeframe where the pattern works. It can show up on a five-minute intraday chart just as easily as it can on a monthly one. The same goes for markets, with the setup appearing in everything from cryptocurrency and stock CFDs to forex and commodities.
Is the megaphone pattern bullish or bearish?
A megaphone pattern isn't automatically bullish or bearish, it depends on which side the pattern is breaking out.
- A close above the upper trend line, with confirming higher volume and follow-through, can point to a move higher or a bullish continuation.
- A close below the lower trend line, with increasing participation, can signal a breakdown or a move lower.
However, the most important thing is that where the pattern appears can change how you should interpret it. After a long uptrend, a megaphone can show that selling pressure is starting to catch up with buyers. That can sometimes lead to distribution and a reversal.
If price has been weak or stuck in a range for a while, though, the same pattern can break higher when buyers finally start to gain the upper hand.
What does the megaphone pattern tell traders?
The megaphone pattern reflects a market where buyers and sellers are both becoming more aggressive, but neither side can hold control for very long.
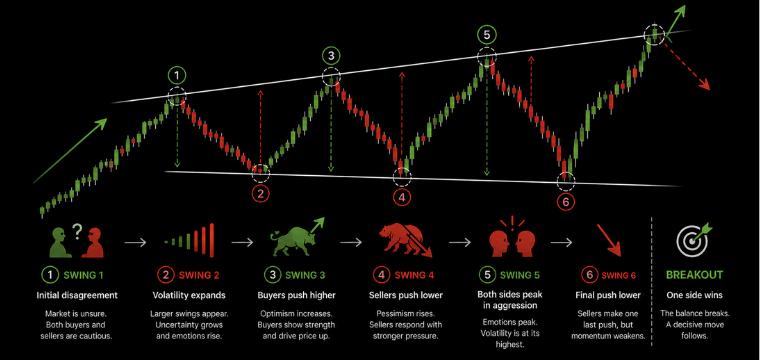
Buyers push price to a new high, making the market look bullish. Sellers respond with a deeper pullback and take price below the previous low. Then buyers step in again and push to another high. As this keeps happening, the swings become larger and the range continues to widen. Volume may also increase as more traders join the move and price becomes more volatile.
The megaphone pattern does not tell traders whether the eventual breakout will be bullish or bearish. Instead, it shows that price is becoming more volatile, which can lead to a strong move once one side finally takes control.
How to identify a megaphone pattern on a chart
Follow these steps to identify a megaphone pattern:
- Look for wider swings: Each new high should move above the one before it, while each new low should fall below the previous low.
- Look for at least five swing points: With fewer than five alternating highs and lows, there simply isn't enough price action to tell whether a real pattern is forming.
- Draw the two diverging trend lines: Run one line through the swing highs and another through the swing lows. The lines should move away from each other as the pattern develops, rather than coming together or staying roughly parallel.
- Look for at least two touches on each line: Once price reacts to the same boundary twice or more, the line becomes a much more useful part of the pattern.
- Watch what happens to volume: Volume should ideally pick up as the swings get larger. That helps show the widening moves are coming with real market activity, rather than happening in an unusually thin market.
- Wait for the price to break out: As long as price is moving inside the formation, the pattern is still developing. When price breaks above or below the boundary is what gives the setup its actual trading signal.
Types of Megaphone Patterns
Not all the Megaphone patterns formed look the same, and some can differ widely. Knowing which variation is taking shape can make it easier to read the market and decide how to approach the setup.
The megaphone top and megaphone bottom are the two main versions. Symmetrical, ascending, and descending forms also show up across different market participants and timeframes.
Megaphone Top
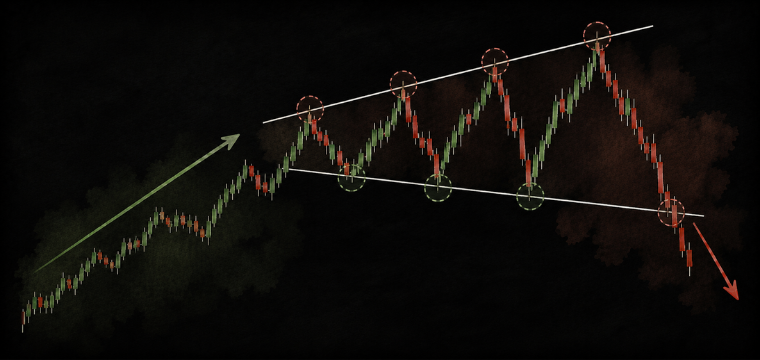
A megaphone top usually appears after a strong uptrend and can warn that the trend is starting to lose its footing. Price is still making higher highs, so buyers have not disappeared, but the pullbacks are getting deeper as sellers become more aggressive.
The widening swings can point to a market that is becoming increasingly unstable near the top rather than one moving higher with confidence.
Megaphone Bottom
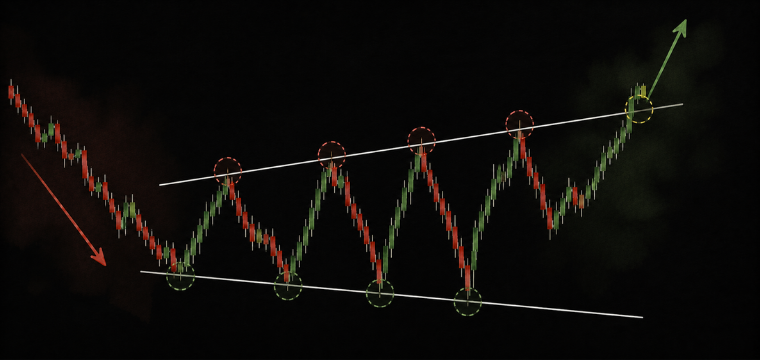
A megaphone bottom or bullish megaphone pattern tends to appear after a downtrend or around heavily depressed price levels. Sellers are still managing to push price to new lows, but the rallies between those lows are getting stronger too. That suggests buyers are starting to push back, and an upward breakout could occur.
The pattern itself does not guarantee a reversal, but if buyers eventually break through the upper boundary, the move can be sharp.
Symmetrical Megaphone
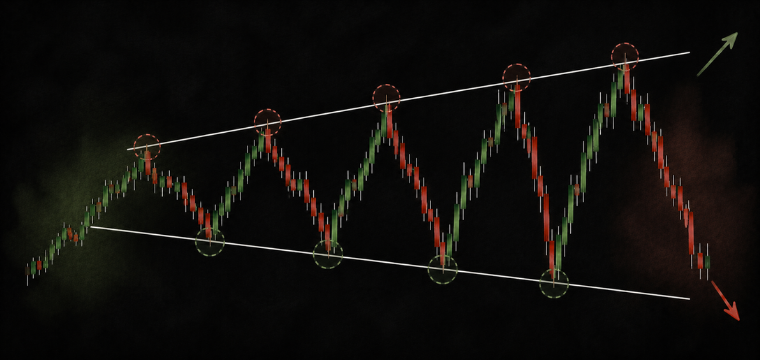
In a symmetrical megaphone, the pattern spreads out fairly evenly above and below price. Neither trendline has a dramatically different slope from the other. Both buyers and sellers are becoming more aggressive, which is why the swings keep getting larger without either side taking clear control.
This version can be particularly difficult to trade because there is little in the shape of the pattern alone to suggest which way the eventual breakout will go.
Ascending and Descending Broadening Formations
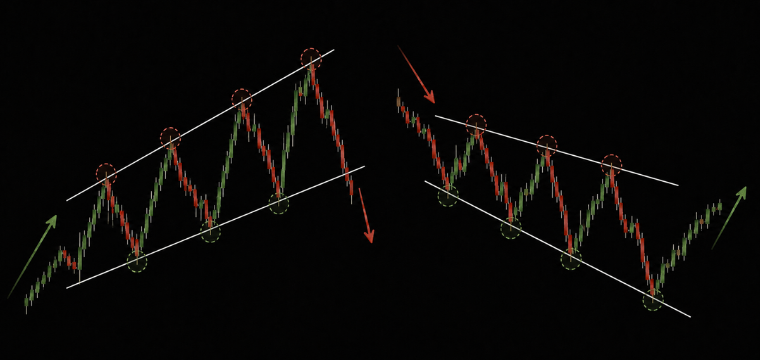
An ascending broadening formation has two rising trendlines, although the upper line climbs faster than the lower one. That difference is what creates the widening range. A descending version works the other way around: both lines slope down, but the lower trend lines drops faster.
These formations are not exactly the same as a symmetrical megaphone, so lumping them all together can lead to a sloppy reading of the chart. The basic idea is similar, but the direction and slope of the boundaries still matter.
How to Trade the Megaphone Pattern
You can trade the megaphone pattern two ways: either a breakout of the pattern or trade swings while price is still inside it.
These two different approaches come with different risks, and one may suit a trader better depending on the timeframe and trading strategies.
Trading a Megaphone Breakout
With a breakout strategy, the trade is taken after price closes outside one of the two trend lines. This is the approach most traders use because it avoids trying to predict which swing will come next and can offer a clearer entry when the breakout has enough momentum behind it.
- Entry: Enter above the upper trendline after a bullish breakout, or below the lower trendline after a bearish break.
- Confirmation: Wait for a candle to close outside the trendline. A noticeable increase in volume compared with recent candles adds further confirmation.
- Stop loss: Keep the stop just inside the broken trendline. If price moves back into the formation, the breakout may have failed and the trade can be closed.
- Target: One common method is to take the pattern's maximum height, measured from the highest high to the lowest low, and project that distance from the breakout point. Nearby support or resistance can also provide sensible areas to take profit.
Trading Inside the Megaphone Pattern
For short timeframe traders the swings within the megaphone could work better rather than wait for a breakout.
This approach needs tighter attention to risk because the swings can be wide and price can turn quickly.
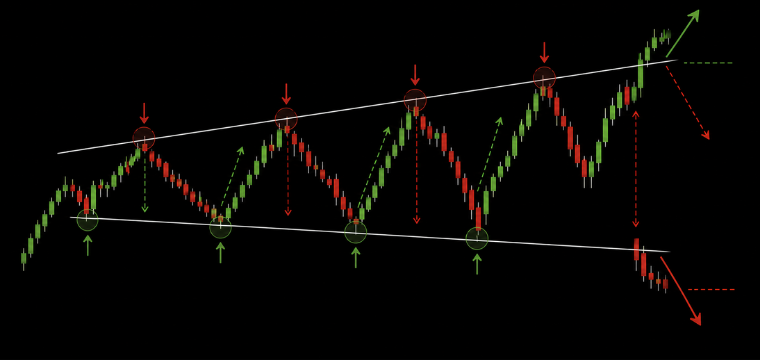
- Near the lower trendline: Watch for signs that buyers are stepping in, such as a pin bar, bullish engulfing candle, or another clear reversal signal, before taking a long position.
- Near the upper trendline: Look for signs of selling pressure as price reaches the upper boundary before considering a short.
- Stop loss: For a long trade, place the stop order below the lower trendline. For a short, place it above the upper trendline.
- Target: The opposite trendline is the obvious first target. However, taking some profit before price reaches the other side can make sense because the pattern can reverse sharply without much warning.
Megaphone pattern stop loss and risk management
Managing risk with a megaphone pattern can be tricky because the swings get wider as the formation develops. That often means giving a trade more room before the stop is reached, which can have a direct impact on position size.
A few things are worth keeping in mind:
Wider stops mean smaller positions: If the stop needs to be 5–8% away from the entry to sit beyond the trendline, the position size should come down accordingly. A position that is three times smaller than usual can help keep the amount at risk in line with the rest of the trading plan.
Avoid entering in the middle: A trade opened halfway between the two trendlines usually leaves little room to work with. A tight stop can get caught by a normal swing, while a wider stop may leave too much distance between the entry and the point where the trade is proven wrong.
Expect false breakouts: Price can move through either trendline and then quickly turn back into the pattern. This is common with megaphones because both sides are active. Waiting for a candle to close beyond the boundary can help filter out some of these moves.
Final Thoughts
The megaphone pattern can be useful when a market starts getting more volatile and uncertain. The widening highs and lower lows give traders clear levels to watch, but the pattern alone isn't enough to justify a trade. The breakout still needs to make sense alongside price action, volume, nearby support and resistance, and the broader market trend.
The megaphone pattern is easier to trade when a platform provides no delay between spotting the setup and acting on it. Change gives traders access to advanced trading and multi-asset instruments through a mobile-first app.
FAQs
What is a megaphone pattern in trading?
A megaphone pattern is a chart formation with widening highs and lows that signals increasing market volatility and uncertainty.
Is the megaphone pattern bullish or bearish?
A megaphone pattern can be bullish or bearish, depending on the direction of the breakout and broader market conditions.
How do you trade a megaphone pattern?
Traders typically wait for a confirmed breakout above resistance or below support before entering a position.
What does a megaphone pattern indicate?
The pattern indicates rising volatility, with buyers and sellers pushing price to increasingly higher highs and lower lows.
Is the megaphone pattern reliable?
The megaphone pattern can provide useful trading signals, but confirmation from price action, volume, and other indicators can help reduce false breakouts.
-1%201%20(1).webp)