Order Flow Trading: How to Read Buying and Selling Pressure

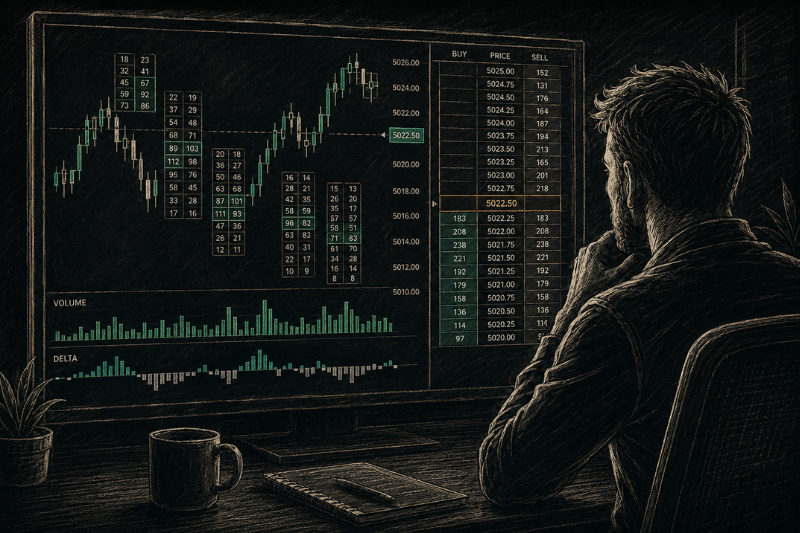
Why does price sometimes break a level strongly, while other times it fails even when the candle looks powerful?
Most traders only see the final result on the chart. They see candles, patterns, support, resistance, and indicators. Order flow trading goes one step deeper by looking at the buying and selling activity behind those price moves.
In this guide, you will learn what order flow trading is, how market orders and limit orders affect price, and which tools traders use to read buying pressure, selling pressure, liquidity, and trade setups.
Key Takeaways
- Order flow trading helps traders identify where significant orders may be waiting and whether buyers or sellers are actually in control.
- Its real value is not predicting every move, but confirming trade ideas and avoiding weak signals.
What Is Order Flow Trading?
Order flow trading is a trading strategy that studies how buy and sell orders enter the market.
The goal is to understand whether buyers or sellers are more aggressive at a specific moment. When buyers enter with strong market orders, price may move higher. When sellers become more aggressive, price may move lower.
A normal candlestick shows the open, high, low, and close. It tells traders what happened. Order flow shows more of the process inside that candle, including:
- where volume traded
- whether buying or selling was stronger
- how price reacted at each traded price
- whether liquidity supported or rejected the move
This is why order flow trading focuses on the interaction between market orders and limit orders.
Market Orders and Limit Orders
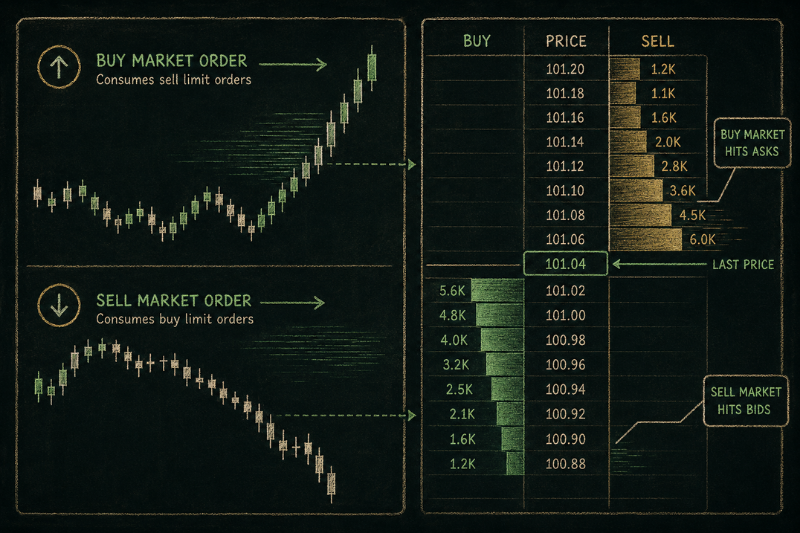
Market orders execute immediately at the best available price. They show urgency because the trader wants to enter or exit now.
Limit orders wait at a specific price level. They add liquidity because they sit in the order book until another trader trades against them.
Price moves when aggressive market orders consume available limit orders. If buyers keep lifting the offer, price may move higher. If sellers keep hitting the bid, price may move lower.
However, price reaction matters more than order size alone. For example, Strong buying at resistance can still fail if sell limit orders absorb the move.
Order Flow vs Traditional Technical Analysis
Traditional technical analysis uses indicators, price action, chart patterns, support and resistance, and volume-based studies. These methods rely on historical market data to understand structure, trend, and important price levels.
Order flow analysis focuses more on live trading activity. It looks at how market orders, limit orders, traded volume, and liquidity interact as price moves.
For that reason, order flow should not replace technical analysis completely. It works best as a confirmation layer. A trader may first identify support or resistance using price action, then use order flow to check whether buyers or sellers are actually active at that level.
Key Components and Tools Used in Order Flow Analysis
Effective order flow analysis depends on reading the right tools together. Most traders do not rely on one signal. They combine market data to see whether buying or selling activity supports the trade idea.
Footprint Charts
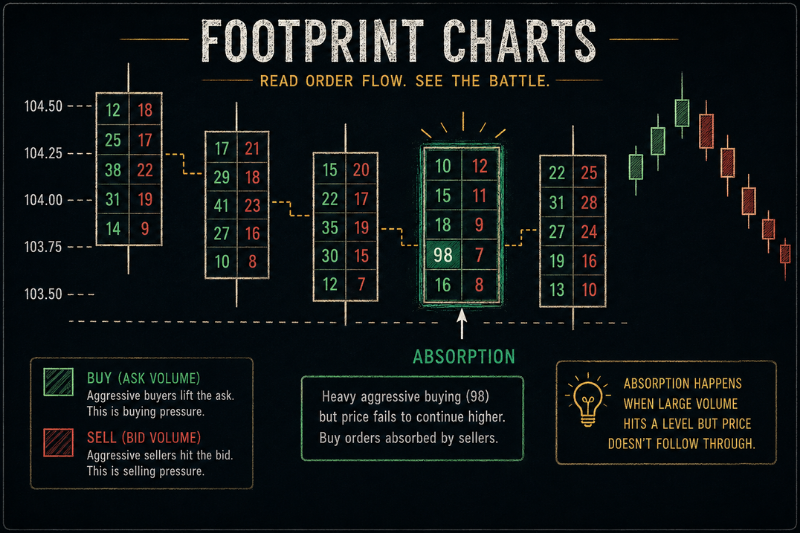
Footprint charts show traded volume inside each candle.
Instead of seeing only the open, high, low, and close, traders can see how much volume traded at different price levels. This helps identify buying pressure, selling pressure, imbalances, absorption, and high-volume areas.
A footprint chart can show:
- volume traded at the bid
- volume traded at the ask
- delta inside the candle
- high-volume price levels
- possible imbalances or absorption
For example, heavy buying at resistance can still warn traders against a weak breakout if price fails to continue.
Depth of Market DOM
Depth of market, or DOM, shows visible resting liquidity at different price levels, including buy limit orders below price and sell limit orders above it.
DOM is especially useful in futures trading because many futures markets provide centralized order book data. Traders use it to watch resting orders, bid and ask changes, and price reactions around key levels.
However, DOM can be misleading if used alone. Some visible orders may be cancelled before execution, so traders often combine it with footprint charts to confirm whether volume actually traded.
Time and Sales Data
Time-and-sales data show executed trades in real time. It usually displays the traded price, trade size, and execution time.
While DOM shows resting liquidity, time and sales confirm what actually traded. For example, a fast sequence of large sell orders hitting the bid may show stronger selling pressure.
Cumulative Volume Delta and Volume Profile
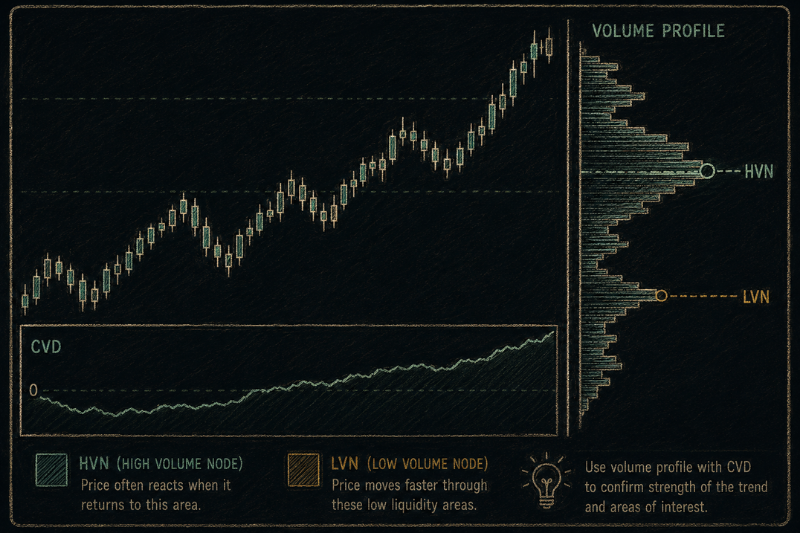
Cumulative volume delta, or CVD, tracks the difference between aggressive buying and aggressive selling. If more volume trades at the ask, CVD rises. If more volume trades at the bid, CVD falls.
Volume profile shows how much volume is traded at each price level over a selected period. High volume nodes show active trading areas, while low volume areas often show where price moved faster.
Together, CVD helps traders read current pressure, while volume profile identifies important price levels from previous trading activity.
Benefits of Order Flow Trading
Order flow trading can help traders improve timing, confirm price action setups, and understand why price fails at certain levels.
Its value comes from showing whether real trading activity supports or rejects a trade idea. This can help traders avoid weak breakouts, refine entries, and manage exits around high-volume areas or at key levels.
Ready to test your strategy in a real market environment?
Top One Trader can be the right choice, offering Instant Funding, 1-Step, and 2-Step funded account models. Traders also get access to educational content, advanced trading platforms, competitive prices, and other features designed to support different trading styles.
Practical Order Flow Trading Strategies
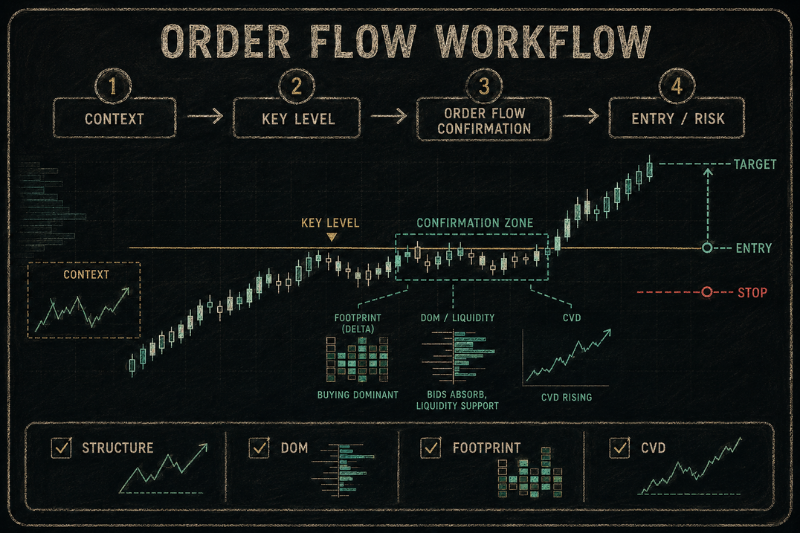
Order flow trading strategies work best when traders start with context.
Instead of watching every tiny move, traders can first mark important price levels, then use order flow analysis to confirm buyer and seller behavior.
Breakout Confirmation
A breakout is stronger when price breaks a key level and order flow supports the move.
For a bullish breakout, traders may look for aggressive buying, rising CVD, and price holding above resistance. For a bearish breakout, they may look for aggressive selling, falling CVD, and price holding below support.
The key question is whether real trading activity supports the break. If price breaks higher but buying dries up, or breaks lower but sellers fail to continue, the breakout may be weak. If strong activity appears but price rejects the level, this may suggest absorption or delta divergence.
Absorption at Key Levels
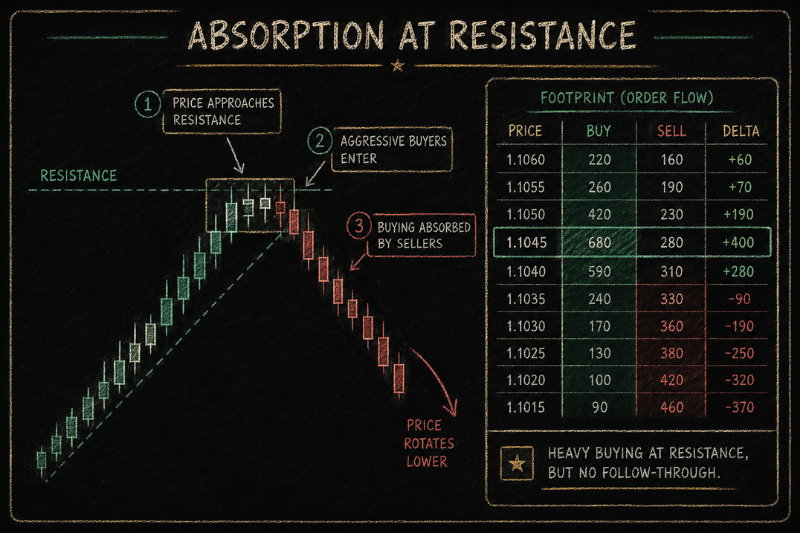
Absorption happens when aggressive market orders enter the market, but price fails to continue.
At resistance, aggressive buying may appear. If price fails to move higher, sell limit orders may absorb that buying. At support, aggressive selling may appear. If price fails to move lower, buy limit orders may be absorbing the selling pressure.
For example, if price breaks above resistance with heavy buying but fails to hold, a trader may wait for price to move back below the level before considering a failed breakout setup.
Pullback Continuation
Order flow can also help traders confirm pullbacks.
In an uptrend, price may pull back into support. The trader can then watch whether selling pressure weakens and buying pressure returns. In a downtrend, price may pull back into resistance and traders watch whether buying weakens before sellers step back in.
A simple workflow looks like this:
- Identify market structure and direction.
- Mark key levels or liquidity zones.
- Wait for price to reach the level.
- Check footprint charts, DOM, CVD, or volume profile.
- Confirm whether price accepts or rejects the level.
- Define entry, stop-loss, and exit points before entering.
This keeps order flow structured instead of reactive.
Limitations of Order Flow Trading
Order flow analysis can be useful, but traders should understand its limits before using it in a strategy.
Order Flow Is Not a Magic Signal
Order flow shows current market behavior, but it does not guarantee future price movements. A strong imbalance can fail, and a breakout can reverse if the wider context does not support the move.
Hidden Liquidity
Not all liquidity is visible. Large market participants may use hidden liquidity, iceberg orders, or order splitting, which means the real buying or selling interest may not appear clearly on the chart.
Data Quality Matters
Order flow depends on reliable market data. Futures markets often provide centralized order book data, while spot data may depend on the broker, liquidity provider, or trading platform.
Unexpected News Events
Unexpected or high-impact news can quickly change sentiment and liquidity. Price may move sharply, spreads may widen, and order flow signals can become less reliable.
Final Thoughts
Order flow trading helps traders read buying pressure, selling pressure, traded volume, and price reactions around important levels.
It is not a shortcut or a standalone signal. It works best when combined with price action, market structure, key levels, and proper risk management to make better decisions when price reaches important areas.
Ready to trade with a trusted prop firm?
Top One Trader offers Instant Funding, 1-Step, and 2-Step funded account options with clear rules, competitive pricing, and advanced trading platforms, helping traders focus on discipline, risk management, and strategy execution.
FAQ
What is order flow trading?
Order flow trading analyzes real-time buy and sell orders entering the market. It helps traders understand liquidity, traded volume, buying pressure, selling pressure, and price reactions.
What tools are used for order flow analysis?
Common tools include footprint charts, depth of market DOM, time and sales, cumulative volume delta, volume profile, and advanced trading software.
Why is order flow popular in futures trading?
Futures trading is popular for order flow because many futures markets provide centralized order book data, transparent traded volume, and reliable market information.
Can order flow replace technical analysis?
No. Order flow works best when combined with concepts such as price action, key support and resistance levels, and market structure. Traders often use it as confirmation when the trade signal from order flow is aligned with the broader market bias.
-1%201%20(1).webp)