Auction Market Theory: Reading Price Balance and Imbalance

Have you ever wondered why prices move strongly from one area to another, then suddenly slow down?
This is not a random movement. It is the result of constant interaction between buyers and sellers. There are many ways to analyse that interaction, and one of the most effective is auction market theory.
In this guide, you will learn how AMT helps traders read balance, imbalance, fair value, and price discovery more clearly, and use that context to make better trading decisions.
Key Takeaways
- The auction market theory helps traders understand buyer and seller interaction through balance, imbalance, and price discovery.
- Tools like Market Profile and Volume Profile help traders identify fair value, key volume areas, and potential turning points for better entries and exits.
What Is Auction Market Theory?

Auction market theory, often called AMT, is the idea that financial markets operate as a continuous two-way auction between buyers and sellers.
The market moves higher or lower to find prices where enough market participants are willing to trade. When buyers and sellers repeatedly trade around the same area, that zone is often seen as fair value.
In simple terms, AMT helps traders answer three questions:
- Where is price being accepted?
- Where is price being rejected?
- Is the market balanced or searching for new value?
AMT does not give automatic buy or sell signals. Instead, it helps traders understand the auction process behind price movement, balance, imbalance, and price discovery.
How Fair Value, Balance, and Imbalance Work
Fair value is the price area where the market traded the most during a specific period. In auction market theory, this does not mean the asset is fundamentally cheap or expensive. It simply means buyers and sellers were most willing to trade there.
A balanced market forms when price stays around fair value. These conditions often create slower price action, rotations, and trading ranges.
An imbalanced market forms when one side becomes more aggressive. Buyers may push price higher in search of new sellers, or sellers may push price lower in search of new buyers.
This is where auction market theory becomes practical. Traders do not need to predict every move. The goal is to read whether price is being accepted or rejected at important levels.
If price accepts outside a previous value area, the market may be building new value. If price breaks out and quickly returns, the move may be a failed auction.
Example: GBP/USD Value Area Reaction
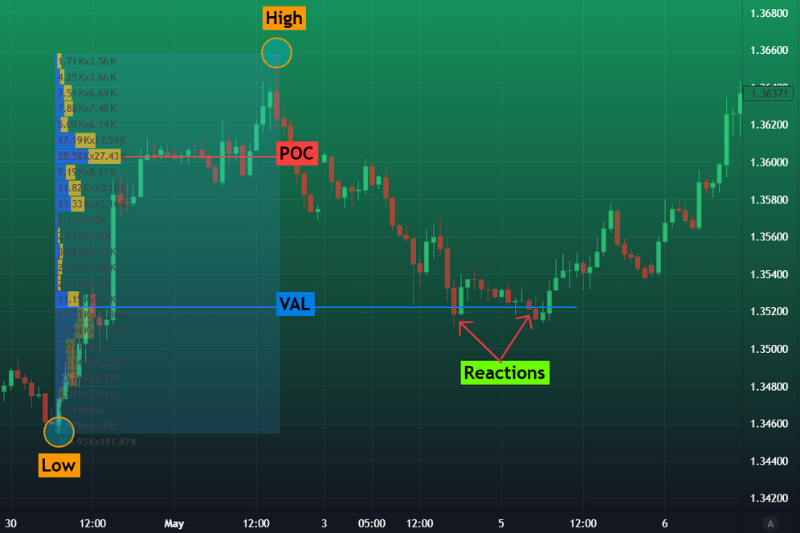
This GBP/USD 1-hour chart shows an auction market theory example using Fixed Range Volume Profile. The volume profile is drawn from swing low to swing high to measure where the market created value.
- POC: The red line marks the Point of Control, where the highest volume is traded.
- VAL: The blue line marks the Value Area Low, the lower edge of the accepted value area.
- Reaction at VAL: Price later returned to the VAL area and reacted from that level.
- AMT context: The market first built value, then later tested the edge of that value area before moving away.
Market Participants, Order Flow, and Price Discovery
Markets move because buyers and sellers interact through orders. In auction market theory, what matters most is aggression.
There are two main sides to this process:
- Aggressive participants: use market orders because they want immediate execution.
- Passive participants: use limit orders, which wait at specific levels and provide liquidity.
Order flow is the interaction between these buy and sell orders. When aggressive buyers keep lifting offers and sellers cannot absorb them, price moves higher. When aggressive sellers keep hitting bids and buyers cannot absorb them, price moves lower.
This movement is called price discovery. The market tests different levels until it finds an area where trade can happen again.
This is why AMT traders study order flow, market participants, and volume analysis. They want to understand who is in control of the current auction price.
Looking for a funded account that matches your trading style?
Top One Trader offers Instant Funding, 1-Step, and 2-Step challenges with competitive prices, advanced platforms, and educational content to help traders learn, prepare, and improve their execution.
Market Profile vs Volume Profile in Auction Market Theory
Market Profile and Volume Profile are two common tools traders use to apply auction market theory. They are related, but they measure different things.
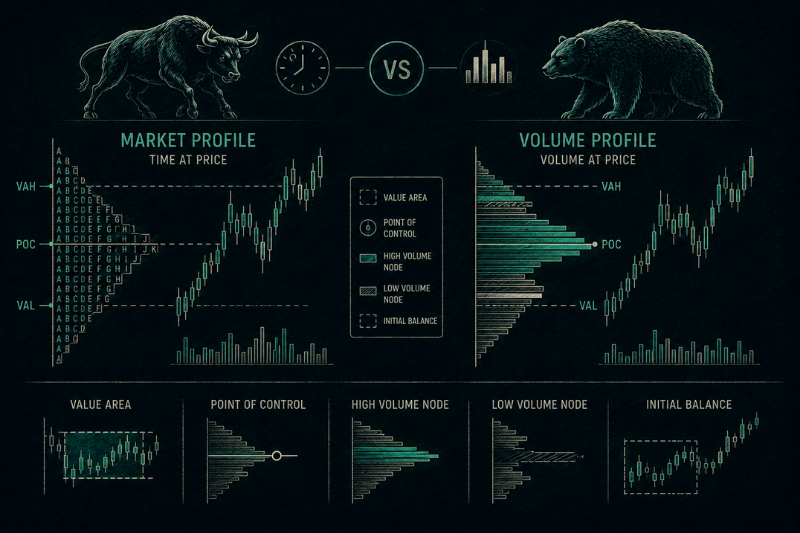
Market Profile shows how much time price spent at each level. It uses TPOs, or time-price opportunities, to show where the market traded during a specific period.
Volume Profile shows how much volume traded at each price level. Instead of focusing on time, it focuses on actual trading activity.
Both tools help traders identify key AMT levels:
The Point of Control shows where the market found the most agreement during that period. High volume nodes often show accepted price areas where price may slow down or rotate. Low-volume nodes show areas with little prior activity, where price may move more quickly.
This helps traders avoid random support and resistance. Instead, they can use market data to see where value was created and where price moved too quickly to build value.
How Traders Use Auction Market Theory in Practice
AMT gives traders a simple framework for organising chart information before making a decision. Instead of reacting to every candle, they first look at value, acceptance, rejection, and volume behaviour.
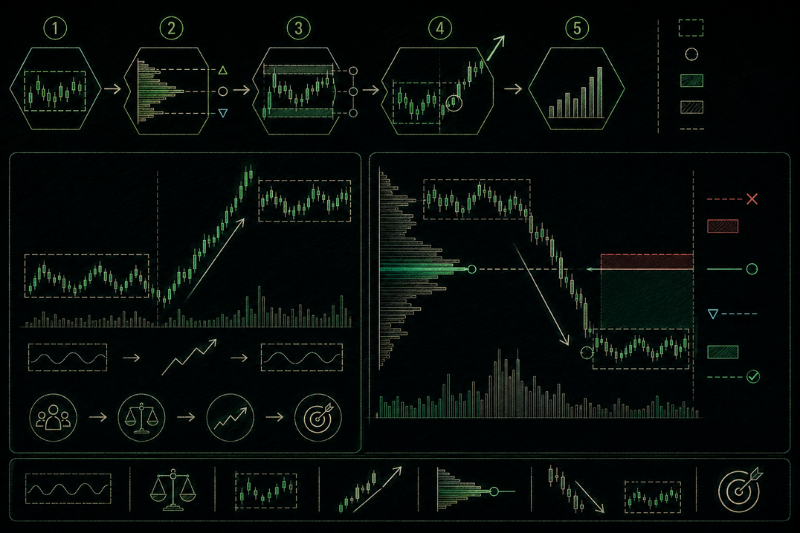
A simple AMT process looks like this:
- Identify the current value area.
- Mark the value area high, value area low, and point of control.
- Watch how price reacts around the edge of value.
- Check whether price accepts outside value or returns back inside.
- Use price action, volume, or order flow as confirmation.
Inside value, traders often watch for rotations toward the POC or the opposite side of the range.
If price accepts outside value, traders may look for continuation toward a new value area.
Example: GBP/JPY Balance to Imbalance
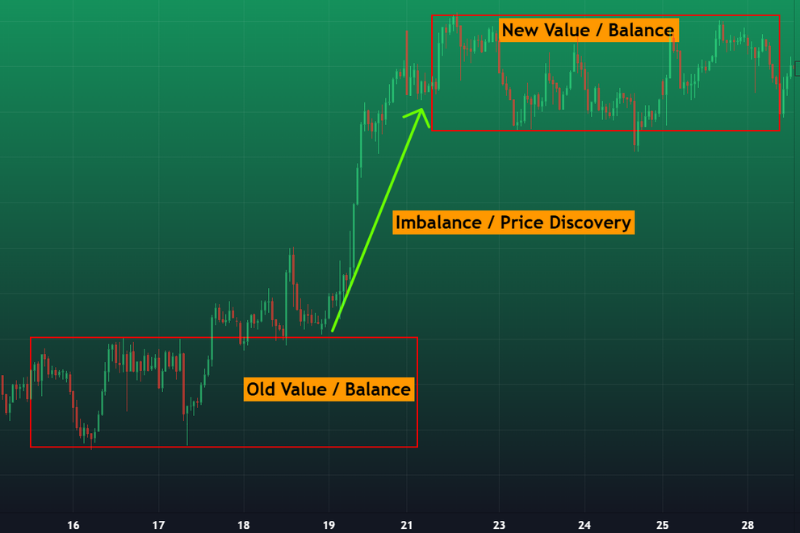
This GBP/JPY 1-hour chart shows a simple auction market theory transition from balance into imbalance through price discovery. Price first trades inside a clear range where buyers and sellers mostly accept the same prices.
After that, strong buying pressure pushes price higher, breaking away from the old value area. Once the move slows down, the market begins rotating again and creates a new accepted range at higher prices.
- Old Value / Balance: Price trades sideways and accepts value inside a balanced range.
- Imbalance / Price Discovery: Strong buying pressure pushes price sharply higher in search of new value.
- New Value / Balance: Price slows down and starts building acceptance in a new higher range.
Example: Combining Auction Market Theory With Fixed Range Volume Profile
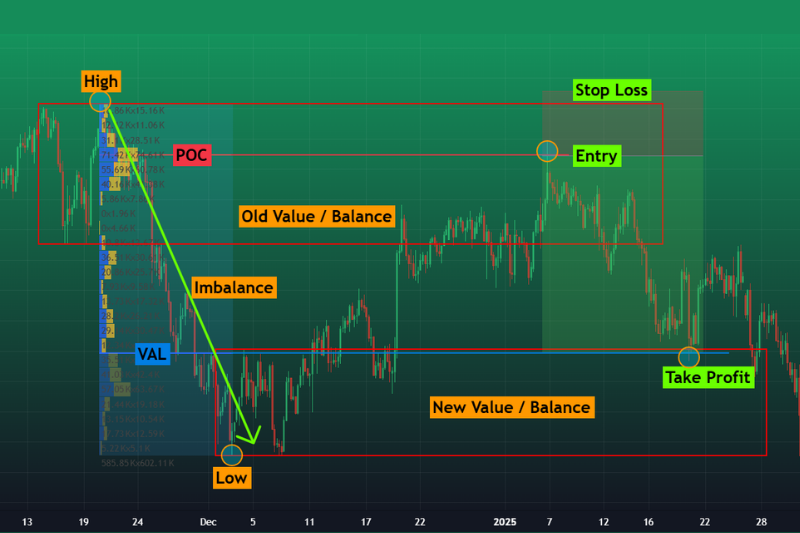
This CAD/JPY 4-hour chart shows how auction market theory can be combined with Fixed Range Volume Profile to create a structured trade idea. Price first creates an old value area near the high.
After failing to continue higher, aggressive selling pushes price lower, creating an imbalance and moving the market away from the old accepted range. As selling pressure slows down, price begins rotating again and forms a new value area near the low.
The Fixed Range Volume Profile is drawn from the swing high to the swing low of the move to identify important levels.
- POC: The Point of Control forms inside the old value area, showing where the most trading activity occurred during the move.
- Reaction at POC: Price later reacts near the POC level, helping define a possible entry.
- VAL: The Value Area Low forms near the new balance area and can act as a logical profit target.
- Risk management: The stop loss is placed above the old value.
This example shows how AMT can help traders identify structured trade opportunities with clearer entries and targets.
Final Thoughts
Auction market theory gives traders a clearer way to understand price movement through balance, imbalance, fair value, and price discovery. It can help traders read whether price is being accepted, rejected, or moving toward a new value area.
However, AMT should not be used alone. It works best when combined with other tools and concepts, such as volume, price action, and a strict risk management plan. The goal is not to predict every move, but to make better decisions with clearer market context.
Ready to trade with a trusted prop firm?
Top One Trader offers multiple challenge types, competitive prices, advanced platforms, and clear rules to help traders grow throughout their trading journey.
FAQ
What are the main auction market theory rules?
The main auction market theory rules are to identify value, watch acceptance or rejection, and decide whether the market is balanced or imbalanced.
How does auction market theory explain market dynamics?
Auction market theory explains market dynamics by showing how buyers and sellers interact around value, imbalance, and price discovery.
How do supply and demand dynamics affect market behavior?
Supply and demand dynamics affect market behavior by showing which side is more aggressive. Strong demand can push price higher, while strong supply can push price lower.
What happens when auction market theory breaks in imbalanced markets?
Auction market theory breaks happen when price leaves value and either accepts a new area or quickly returns back inside the old range.
-1%201%20(1).webp)